Tutorial: Quick start
This tutorial is interactive, and you can open it in a live web environment to try
it out for yourself, without installing anything on your machine! Click here
to proceed: ![]()
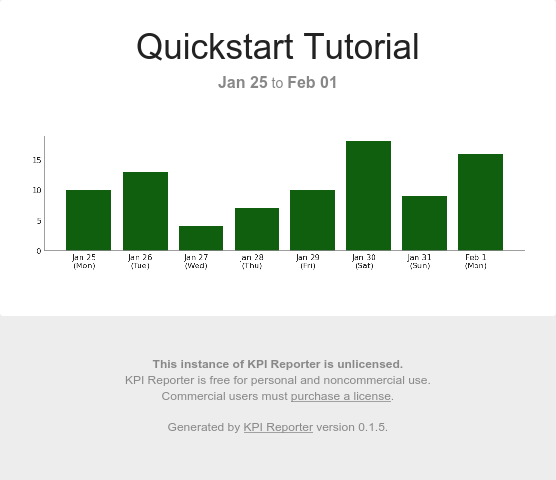
In this tutorial, we will be creating a report that pulls data from a MySQL table that contains a list of the number of users who signed up on each day. From that, we’ll construct a few queries and plug them into some of the default Plot visualizations to make it look nice. Here’s what it should ultimately look like:

Let’s get started!
Install KPI Reporter
For this tutorial, we will only need a few plugins. You can install kpireport[all] to install all available plugins.
pip install kpireport kpireport-mysql kpireport-plot kpireport-static
View output
Requirement already satisfied: kpireport in /opt/conda/lib/python3.8/site-packages (0.1.5)
Requirement already satisfied: kpireport-mysql in /opt/conda/lib/python3.8/site-packages (0.0.2)
Requirement already satisfied: kpireport-plot in /opt/conda/lib/python3.8/site-packages (0.1.2)
Requirement already satisfied: kpireport-static in /opt/conda/lib/python3.8/site-packages (0.1.0)
Requirement already satisfied: pandas in /opt/conda/lib/python3.8/site-packages (from kpireport) (1.2.1)
Requirement already satisfied: jinja2 in /opt/conda/lib/python3.8/site-packages (from kpireport) (2.11.2)
Requirement already satisfied: python-slugify in /opt/conda/lib/python3.8/site-packages (from kpireport) (4.0.1)
Requirement already satisfied: stevedore in /opt/conda/lib/python3.8/site-packages (from kpireport) (3.3.0)
Requirement already satisfied: pyyaml in /opt/conda/lib/python3.8/site-packages (from kpireport) (5.4.1)
Requirement already satisfied: authlib in /opt/conda/lib/python3.8/site-packages (from kpireport) (0.15.3)
Requirement already satisfied: PyMySQL in /opt/conda/lib/python3.8/site-packages (from kpireport-mysql) (1.0.2)
Requirement already satisfied: matplotlib in /opt/conda/lib/python3.8/site-packages (from kpireport-plot) (3.3.4)
Requirement already satisfied: imgkit in /opt/conda/lib/python3.8/site-packages (from kpireport-static) (1.0.2)
Requirement already satisfied: cryptography in /opt/conda/lib/python3.8/site-packages (from authlib->kpireport) (3.3.1)
Requirement already satisfied: cffi>=1.12 in /opt/conda/lib/python3.8/site-packages (from cryptography->authlib->kpireport) (1.14.4)
Requirement already satisfied: six>=1.4.1 in /opt/conda/lib/python3.8/site-packages (from cryptography->authlib->kpireport) (1.15.0)
Requirement already satisfied: pycparser in /opt/conda/lib/python3.8/site-packages (from cffi>=1.12->cryptography->authlib->kpireport) (2.20)
Requirement already satisfied: MarkupSafe>=0.23 in /opt/conda/lib/python3.8/site-packages (from jinja2->kpireport) (1.1.1)
Requirement already satisfied: pyparsing!=2.0.4,!=2.1.2,!=2.1.6,>=2.0.3 in /opt/conda/lib/python3.8/site-packages (from matplotlib->kpireport-plot) (2.4.7)
Requirement already satisfied: kiwisolver>=1.0.1 in /opt/conda/lib/python3.8/site-packages (from matplotlib->kpireport-plot) (1.3.1)
Requirement already satisfied: cycler>=0.10 in /opt/conda/lib/python3.8/site-packages (from matplotlib->kpireport-plot) (0.10.0)
Requirement already satisfied: python-dateutil>=2.1 in /opt/conda/lib/python3.8/site-packages (from matplotlib->kpireport-plot) (2.8.1)
Requirement already satisfied: pillow>=6.2.0 in /opt/conda/lib/python3.8/site-packages (from matplotlib->kpireport-plot) (8.1.0)
Requirement already satisfied: numpy>=1.15 in /opt/conda/lib/python3.8/site-packages (from matplotlib->kpireport-plot) (1.20.0)
Requirement already satisfied: pytz>=2017.3 in /opt/conda/lib/python3.8/site-packages (from pandas->kpireport) (2020.5)
Requirement already satisfied: text-unidecode>=1.3 in /opt/conda/lib/python3.8/site-packages (from python-slugify->kpireport) (1.3)
Requirement already satisfied: pbr!=2.1.0,>=2.0.0 in /opt/conda/lib/python3.8/site-packages (from stevedore->kpireport) (5.5.1)
Set up test database
For this tutorial, we’ll be using a test database on a local MySQL server. A initdb.sql file has the test data; by updating this file and re-run this step you can re-seed the local database.
cat initdb.sql
View output
CREATE DATABASE IF NOT EXISTS tutorial;

DROP TABLE IF EXISTS tutorial.new_users;
CREATE TABLE tutorial.new_users (
  `date` DATETIME NOT NULL,
  num_new_users INT DEFAULT 0
);

INSERT INTO tutorial.new_users (`date`, num_new_users)
VALUES
    (NOW() - INTERVAL 7 DAY, 10),
    (NOW() - INTERVAL 6 DAY, 13),
    (NOW() - INTERVAL 5 DAY, 4),
    (NOW() - INTERVAL 4 DAY, 7),
    (NOW() - INTERVAL 3 DAY, 10),
    (NOW() - INTERVAL 2 DAY, 18),
    (NOW() - INTERVAL 1 DAY, 9),
    (NOW(), 16);
# Start the server in the background
[[ -f /tmp/mysql.pid ]] || (mysqld &) && while [[ ! -f /tmp/mysql.pid ]]; do sleep 1; done
# Initialize the database and tables
mysql <initdb.sql && echo "Database initialized."
View output
Database initialized.
Run your first report
A config.yaml file contains our report configuration. We will start by defining a Datasource for our MariaDB server and a View displaying the result of a query as a bar chart. Here is the configuration this first report uses:
cat config.yaml
View output
---
title: Quickstart Tutorial

datasources:
    my_db:
        plugin: mysql
        args:
            host: localhost
            user: ${USER}

views:
    num_users:
        plugin: plot
        args:
            datasource: my_db
            query: select * from tutorial.new_users
            kind: bar

outputs:
    html:
        plugin: static
        args:
            output_format: html
    png:
        plugin: static
        args:
            output_format: png
Let’s break down what’s going on.
- In the
datasourcessection, we define a new Datasource and call itmy_db. It uses the MySQL plugin, and allows us to query our MySQL database from within a particular View. - In the
viewssection, we define one view callednum_users. It is going to show a bar chart of the number of users who signed up on that day. Our table has adatecolumn already, so the plotter understands this should be plotted as time-based data. If we had a different column name we could use thedate_columnargument to give the plotter some help. - In the
outputssection we specify that we want the report outputted both in HTML and PNG format. Rendering a report like this to a static file (or group of files) is handled by the Static plugin.
We can now run the report and see how it goes:
kpireport -c config.yaml
View output
INFO:kpireport.plugin:Loaded datasource plugins: ['mysql', 'jenkins', 'prometheus', 'googleanalytics']
INFO:kpireport.plugin:Initialized datasource my_db
INFO:kpireport.plugin:Loaded view plugins: ['jenkins.build_summary', 'plot', 'single_stat', 'prometheus.alert_summary', 'table']
INFO:kpireport.plugin:Initialized view num_users
INFO:kpireport.plugin:Loaded output driver plugins: ['s3', 'slack', 'scp', 'sendgrid', 'smtp', 'static']
INFO:kpireport.plugin:Initialized output driver html
INFO:kpireport.plugin:Initialized output driver png
INFO:kpireport.report:Sending report via output driver html
INFO:kpireport.report:Sending report via output driver png
QStandardPaths: XDG_RUNTIME_DIR not set, defaulting to '/tmp/runtime-jovyan'
Loading page (1/2)
Rendering (2/2)
Done
Generated report in 2553.76ms.
If all went well, we should have a rendered report in the output directory (_build by default.)
cat _build/latest-quickstart-tutorial.png | display
Building out more views
We will now add a few new views:
- Print the total number of users in the database as a single stat view.
- Show a plot of the total number of users over time, using a more advanced SQL query.
The updated configuration looks like this:
cat config-2.yaml
View output
---
title: Quickstart Tutorial v2

datasources:
    my_db:
        plugin: mysql
        args:
            host: localhost
            user: ${USER}

views:
    num_users:
        cols: 4
        plugin: plot
        args:
            datasource: my_db
            query: select * from tutorial.new_users
            kind: bar
    total_users:
        title: Total new users
        cols: 2
        plugin: single_stat
        args:
            datasource: my_db
            query: select sum(num_new_users) from tutorial.new_users
    users_over_time:
        title: Users over time
        plugin: plot
        args:
            datasource: my_db
            query: |
                select `date`, (
                    select sum(num_new_users)
                    from tutorial.new_users u2
                    where u2.`date` < u1.`date`
                ) as total_users
                from tutorial.new_users u1

outputs:
    html:
        plugin: static
        args:
            output_format: html
    png:
        plugin: static
        args:
            output_format: png
We’ll re-run the report with this new configuration:
kpireport -c config-2.yaml
View output
INFO:kpireport.plugin:Loaded datasource plugins: ['mysql', 'jenkins', 'prometheus', 'googleanalytics']
INFO:kpireport.plugin:Initialized datasource my_db
INFO:kpireport.plugin:Loaded view plugins: ['jenkins.build_summary', 'plot', 'single_stat', 'prometheus.alert_summary', 'table']
INFO:kpireport.plugin:Initialized view num_users
INFO:kpireport.plugin:Initialized view total_users
INFO:kpireport.plugin:Initialized view users_over_time
INFO:kpireport.plugin:Loaded output driver plugins: ['s3', 'slack', 'scp', 'sendgrid', 'smtp', 'static']
INFO:kpireport.plugin:Initialized output driver html
INFO:kpireport.plugin:Initialized output driver png
INFO:kpireport.report:Sending report via output driver html
INFO:kpireport.report:Sending report via output driver png
QStandardPaths: XDG_RUNTIME_DIR not set, defaulting to '/tmp/runtime-jovyan'
Loading page (1/2)
Rendering (2/2)
Done
Generated report in 3808.97ms.
The report now renders in a few rows and has the additional views included:
cat _build/latest-quickstart-tutorial-v2.png | display
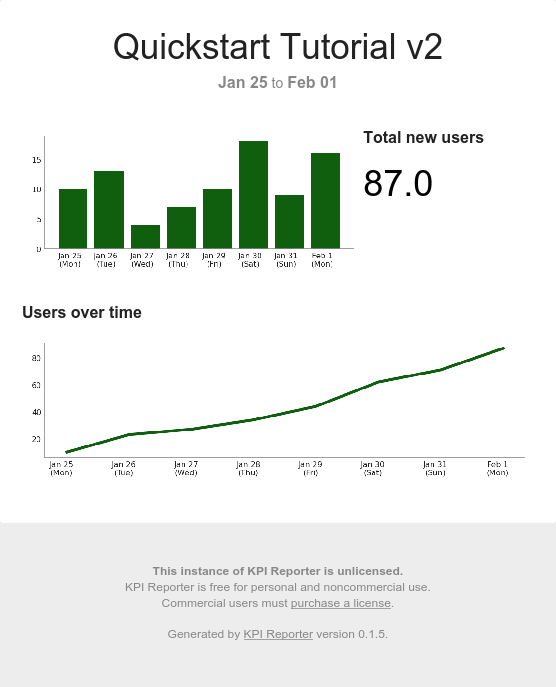
Notice that we added a title to the single stat view to give more context as to what the number indicates. Additionally, the stat view was placed side-by-side with the first plot by adjusting the columns parameter for each view. By default every report uses a 6-column layout, but this can be configured at the theme level.
Have fun!
This example has hopefully given you some ideas on how to get started creating your first report :) If you are interested in not outputting HTML, but instead sending via email, refer to the plugin documentation for, e.g., the SMTP or SendGrid plugins.